
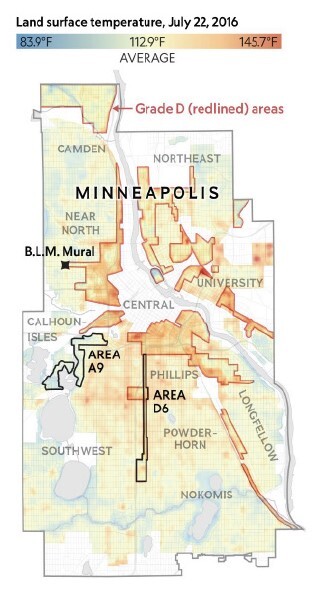
REDLINING AND EXTREME HEAT
People of color and households in poverty being disproportionately exposed to pollution (see our Displacement and Health blog post) isn’t the only way redlining practices of the past are still informing the realities of today. Another concern is exposure to extreme heat. Minneapolis has the third highest heat disparity in the country between areas D-graded redlined areas and A-graded areas—a temperature discrepancy of 10.8 degrees on average. Those exposed to that extra heat are often the city’s most vulnerable: the poorest and disproportionately people of color.
Living day after day in an environment that’s hotter isn’t just uncomfortable. It can have dire, and sometimes deadly, health consequences. Extreme heat results in increased hospital admissions for heat-related illness, as well as cardiovascular and respiratory disorders. “Currently, there is no funding for climate change-related heat adaptation in the city … Nor is there funding to assess the risk systematically, meaning that heat-related illnesses and deaths are likely underestimated.”
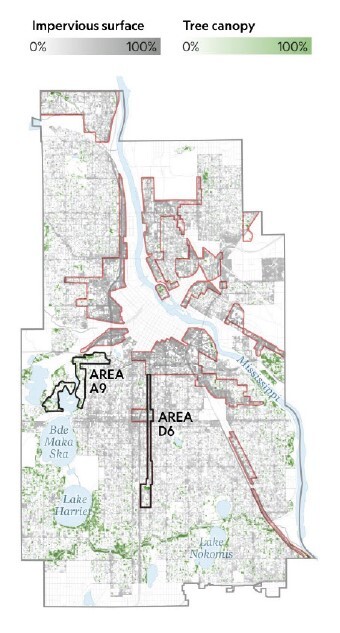
LESS GREEN SPACE IN REDLINED AREAS
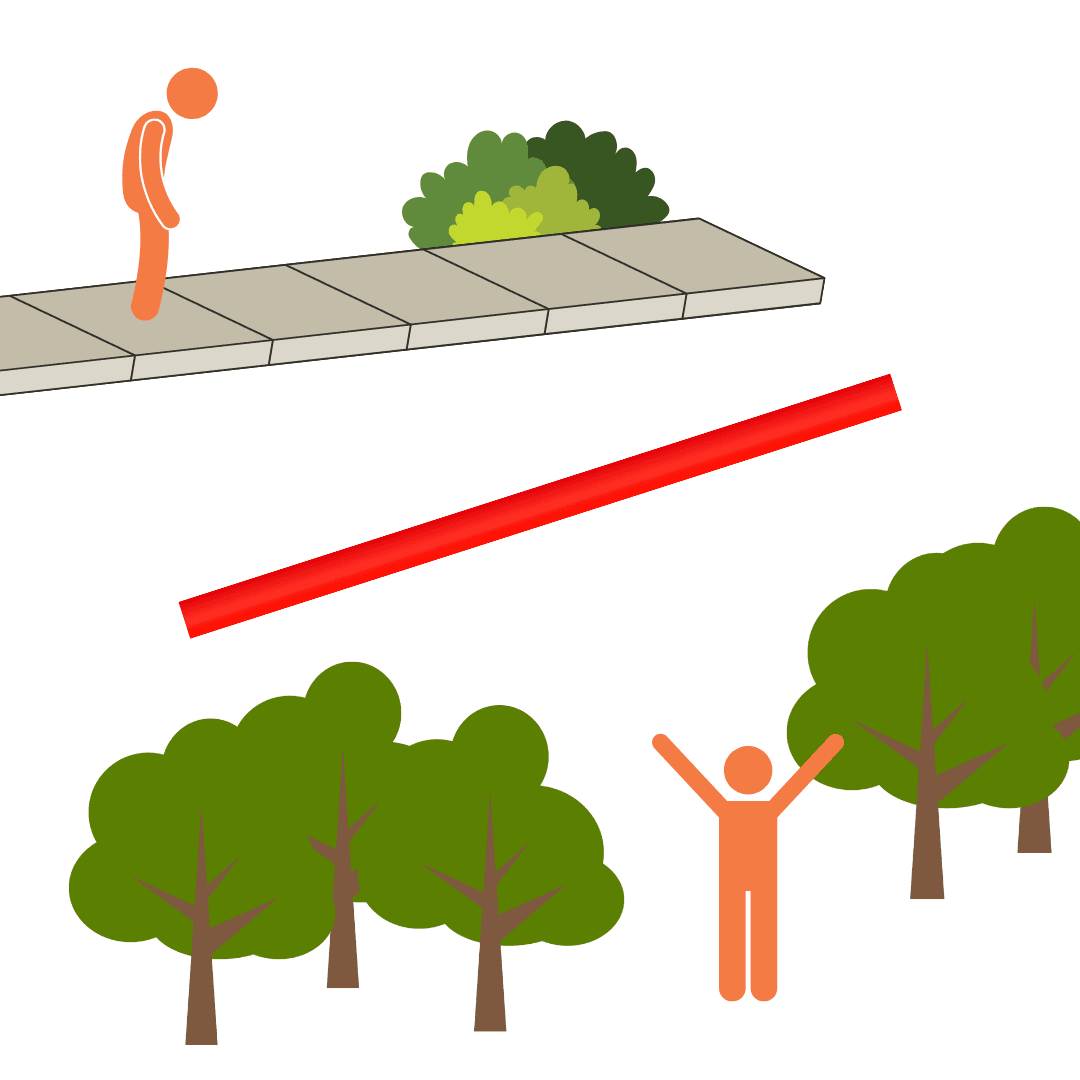
Redlined areas were made vulnerable to large-scale development projects and disrupted green space, contributing to the massive difference in temperature. “Dark surfaces like paved roads or tar-covered rooftops readily absorb heat from the sun. They also tend to hold onto that heat more tightly than natural materials like loose dirt or plants. Big, densely clustered buildings do the same. Once heated up, they release the heat only slowly into the surrounding air like a hot, stale breath.” Fewer trees and more impervious surfaces like parking lots help make redlined areas 5.3 degrees warmer than the city’s average.
Tree canopies are critical to neighborhood livability for many reasons. They reduce heat island effects, improve mental and physical health, reduce stormwater runoff, save energy and money, reduce air pollution, protect natural waterways, absorb sound pollution, increase property values, and reduce wind speed. Low tree canopy coverage is correlated with lower-income neighborhoods. The Minneapolis city average is 27% canopy coverage. In the most tree-covered neighborhoods, the canopy coverage is between 41% and 60%.
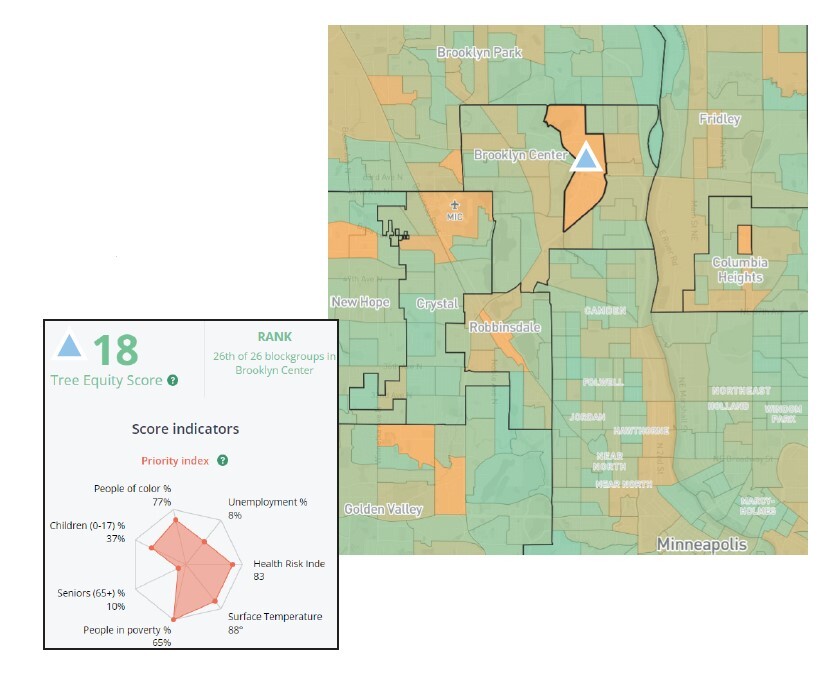
TREE EQUITY
A Tree Equity Score is a metric that helps cities assess how well equitable tree canopy cover is delivered to all residents in the area. It is derived from tree canopy cover, climate, demographic, and socioeconomic data. In the map below, the area in Brooklyn Center marked with the blue triangle is ranked 26th of 26 blockgroups for tree equity with a Tree Equity Score of 18 out of 100. In that same blockgroup, 65% of people are in poverty.
EXTREME HEAT AND ENERGY BURDEN
In addition to the health issues related to extreme heat, energy burden is another hardship for people of color and people with lower incomes. Energy burden is the proportion of household income spent on energy. The average energy burden is 2% in Minnesota. On average, African American and White households pay similar utility bills, but African-American households experienced a median energy burden more than twice that average (5.4%) and much greater than White households (3.3%). Households with lower incomes average an energy burden of 8% with some facing energy burdens over 30%.
ENERGY & WATER SERVICES
CAP-HC is one of the largest providers of energy assistance in Minnesota. Every year, we help thousands of Hennepin County residents with lower incomes maintain continuous energy, water, and heat to keep their homes safe. We also improve energy efficiency of homes and reduce energy burden on an ongoing basis by providing services like furnace repair or insulation improvements.
LEARN MORE
caphennepin.org/eap
Sources: CDC; NPR, Racist Housing Practices from the 1930s Linked to Hotter Neighborhoods Today; NPR, Trees Are Key to Fighting Urban Heat; The Guardian, National Geographic; Citizens Utility Board; Tree Equity Score; Green Minneapolis; 2020-2025 Hennepin County Community Forestry Strategic Plan; Federal Fiscal Year 2022 CSBG Annual Report and CAP-HC 2021 Annual Report; Residential areas on 1934 redlining maps sources: NASA; Jeremy Hoffman; Vivek Shandas